We are now required to collect sales tax in several states. Learn more about tax exempt status for your business.
Some years ago, we heard about a seismometer you could build out of magnets and a slinky. The simple device is sensitive enough to detect powerful earthquakes around the world! Ever since, we’ve been meaning to build one for ourselves.
This project has become popular among science teachers, and is springing up in classrooms all over the world. Whether you’re interested in building one yourself, or just want to read along to see how it’s done, this article shares our experiences building a slinky seismometer for under $100.
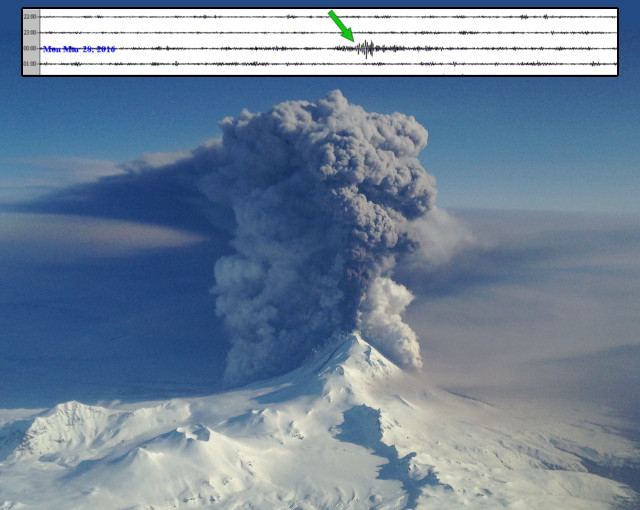
UPDATE: While putting the finishing touches on this article, we heard about a large volcano that erupted in the Aleutian Islands of Alaska. Our tiny seismometer picked it up from 3870 miles (6228 km) away! Read on to see the data...
A seismometer is an instrument that measures motions of the ground. It can detect evidence of earthquakes, nuclear explosions and other seismic sources of motion.
Professional seismometers measure motion in three directions: up and down, north-south and east-west. The one we’re making only detects vertical motion. While a vertical-only seismometer provides less information, it’s a simple place to start.
We like the simple design of a weight hanging on a spring. It's great as a teaching tool, because it’s so intuitively obvious how it works. You understand the idea just by looking at it! To help communicate what the device does, it’s a lot more useful than a sophisticated box of electronics.
While we strayed a bit from the instructions we found online, this is really an iteration of the TC1 seismometer design made by Ted Chanel and the folks at Boise State University. Assume that the great ideas are from them, and any mistakes are ours.
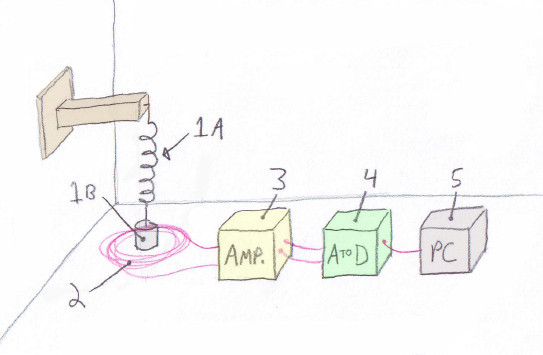
This seismometer detects ground motion with a magnet hanging on a slinky. The magnet is free to bounce up and down. A stationary coil of wire is placed around the magnet. Any motion of the magnet generates tiny currents in the wire, which can be measured.
The rest of the device is essentially some electronics wizardry to measure those tiny currents in the wire and convert them into data we can read. A quick overview sketch is shown.
Let's take a moment to look at each of these components in a little more detail. Skip ahead to find results and earthquakes if you don't want so much detail.
We used a Slinky, Jr., which has a smaller diameter than a full-size slinky. At the bottom of the slinky, we mounted two RC44 ring magnets stacked together on a 6” long piece of #4-40 threaded rod. This stack of magnets sits inside a coil of wire. When these magnets move up and down slightly, it induces currents in the wire. You could also use a single RC48 magnet and get the same result.
The top of the slinky is mounted to a stationary arm at the top. We used an MMS-G-XC mounting magnet with a longer eye-hook stuck to a steel wall. This was easy to make small positional adjustments up and down. You don't have to use a magnet here, but we like magnets!
Choose the length of slinky to make the system have a natural frequency of 1 Hz. That is, the natural bouncing up and down motion should occur about once a second.
There’s also an R848 ring magnet down at the bottom of the threaded rod. The magnet sits inside a little section of copper pipe. This magnet-pipe combination dampens the motion. Without damping, a single bump to the magnet would leave it bobbing up and down for quite a long time. With damping, eddy currents are generated in the copper pipe when the small magnet moves. This produces a drag force, which resists the motion. It’s a clean, consistent solution that never needs any maintenance. Learn more about eddy currents here.
Old-fashioned seismometers used a paddle sticking in a container of oil to dampen motions. That works, but messy liquids can evaporate over time. We like the eddy current solution much better!
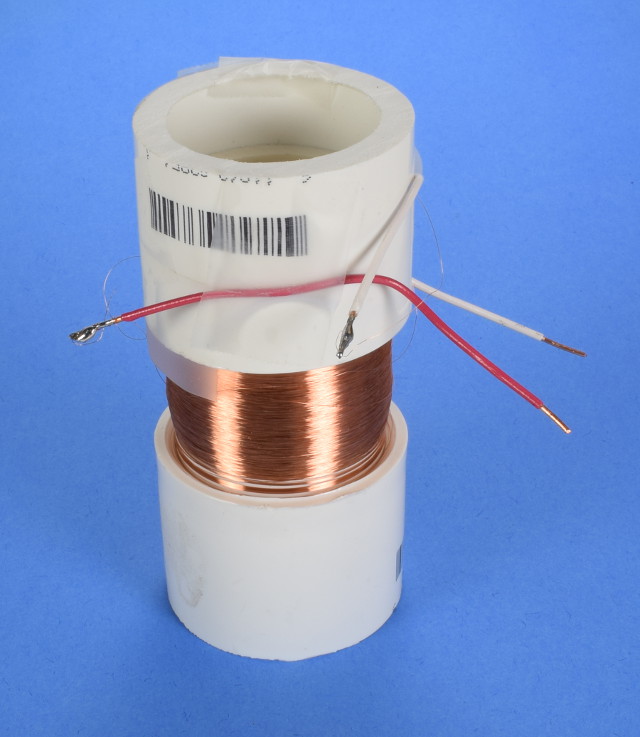
A coil of wire detects the changing magnetic field caused by any motion of the magnet. For the initial prototypes, we cut a section of 1" PVC pipe and wrapped about 2,500 turns of 42 gauge magnet wire around it.
The pipe is a great way to make it from inexpensive, readily available parts. We used PVC end caps pressed on either end of a short section of pipe to form walls on either side of the wrapped wire. We sliced the ends off to open it back up.
Also note the bigger wires in the photos. We soldered the end of the magnet wire to the thicker wire, which is then easier to work with. This magnet wire is too thin for an alligator clip to make a decent electrical connection to. The magnet wire is also frustratingly easy to break accidentally.
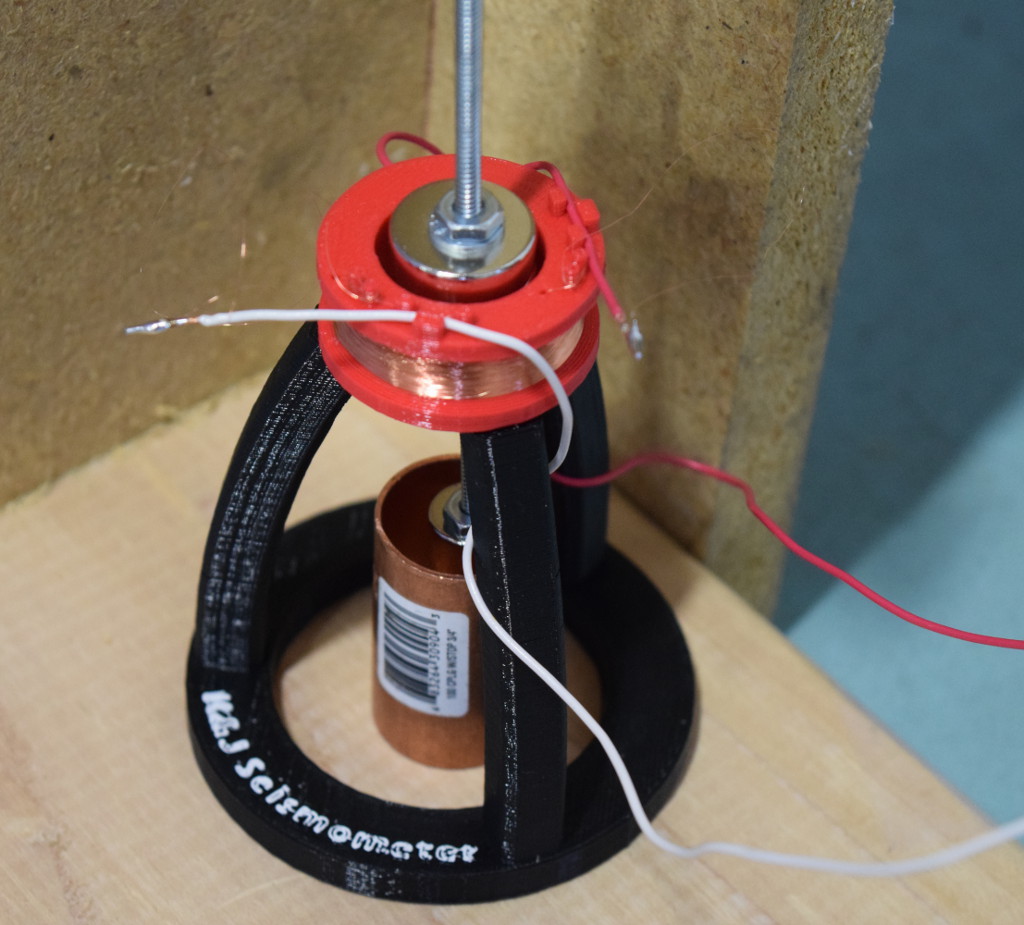
We made a fancier version of a wire spool using some 3D printed parts. This was much easier to wrap, because it attached to the spool-winding feature of an old sewing machine. In the short video below, you can see how we wound it. Like our earlier article about making an Electric Guitar Pickup, a magnet on the spool passing by a reed switch counts the number of turns.
Caution: This wire is really, really fine. It’s thinner than hair. Getting a good coil of wire wound without breaking it is probably the most challenging part of this project. Be prepared for a few false starts, some broken wire, and a bit of a challenge keeping the tension just right.
Whether you use a simple PVC pipe or fancy 3D printed parts, the idea is the same – you need a “spool” to wrap the wire around that’s a little bigger than the magnet that sits inside it.
If you have access to a 3D printer, you can use these 3D models of the stand (black) and spool (red). This shape was used to attach the spool to our sewing machine. It mates to the spool on the top, and looks like a small spindle on the bottom.
In our earlier article about Electric Guitar Pickups, we found that tiny changes in the magnetic field can be picked up with a coil of thin wire. Like the electric guitar needs an amplifier to produce sound, we also need an amplifier to see the tiny signal.
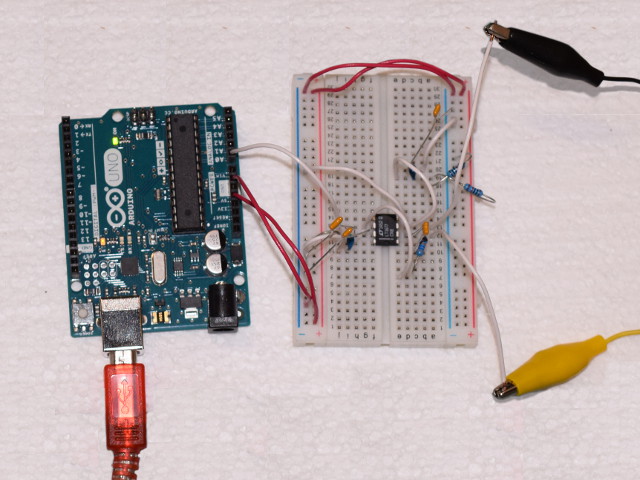
There are lots of good amplifier circuits out there. There are also a lot of circuit-designing electrical engineers who are more saavy than us! We stuck to the circuit used in the TC1 seismometer we found online. Find more technical details in this PDF, but here’s the simple description: This circuit takes in the weak signal from two wires coming from the coil, and outputs an amplified version of the signal.
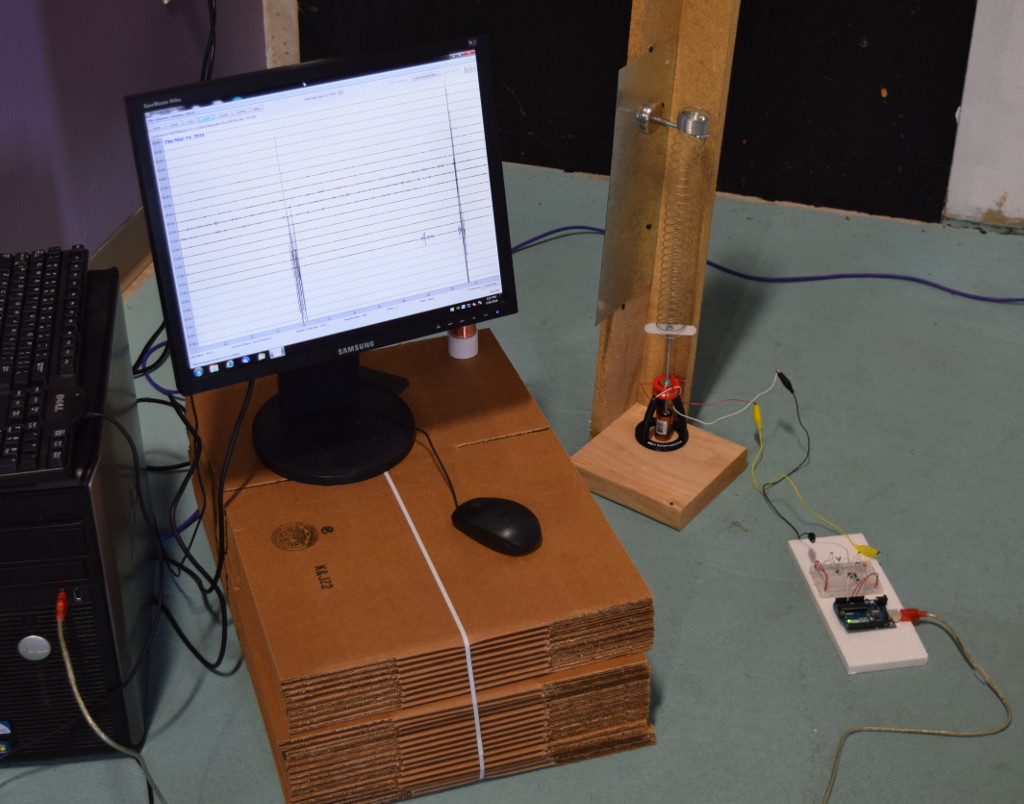
Some of the TC1 documentation showed a special PCB made especially for this amplifier. Since we didn’t have that board, we simply put the components on a prototyping breadboard.
An Arduino is a small, inexpensive microprocessor that’s incredibly popular. It’s easy to learn, and there’s a huge community out there to help if you run into trouble.
If you don’t have any experience with this, we recommend starting with one of the instructional kits that are available. These kits include a breadboard, jumper wires, a number of electronic components and perhaps a dozen sample tutorials to help you get started. While an initial project like making a light turn on and off is very simple, it’s a great place to start learning how the board works, how to program it, how to modify a program, and how to make sure it’s communicating with your PC properly.
The Arduino board takes in the analog input from the amplifier, and translates that into a stream of digital, numerical data. To do this, the Arduino was programmed with code from the TC1 seismometer project.
This code is a program that the Arduino runs. It includes a lot of smart stuff, like oversampling, filtering and noise reduction. If you’re an electrical engineer who’s into clocks, sample rates and frequencies, it’s worth checking out. If reading it makes your eyes glaze over, just load it into the Arduino and let it run.
The code we used has a text file of code that you load into the Arduino board using the application on the PC. It also has a few libraries that the code refers to, which you’ll need to install on your PC. This article has some good advice on how to load libraries into your Arduino.
The Arduino plugs into a PC via USB. You'll need to load the Arduino software and drivers onto your PC. That Arduino software is what you’ll use to get the code from your PC onto the Arduino board, using the “Upload” feature.
Before getting into the next step with jAmaSeis, use the Arduino software to make sure the board is communicating properly. We had to use it a few times to make sure the Arduino was communicating properly with the PC. Click Tools, Serial Monitor. If everything is running properly, you should see a stream of numbers coming in. If not, try making sure it's looking at the right COM port.
To record the data, we used an application on the PC called jAmaSeis, from IRIS, the Incorporated Research Institutions for Seismology. From their site:
jAmaseis is a cross-platform program that collects seismic data from a seismometer, allows users to view and manipulate this data, and shares data with users on the Internet in real time from either a local instrument or from remote stations.
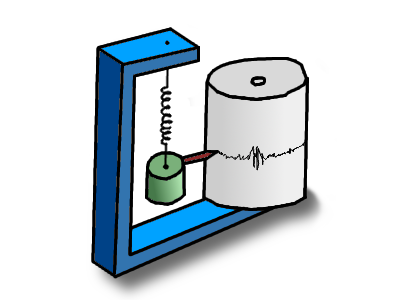
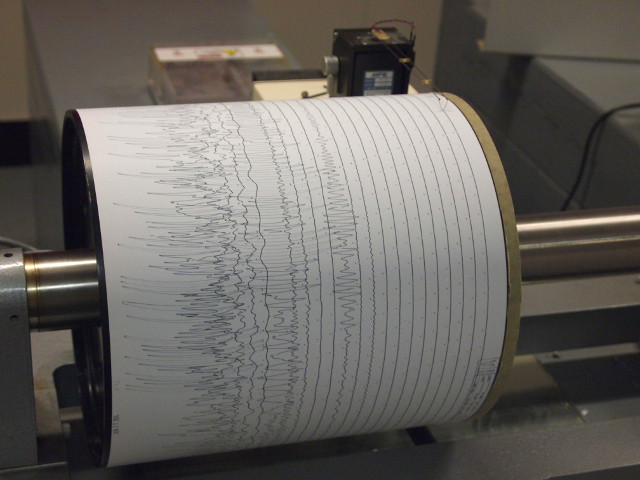
In the old days, seismometers would output to a paper chart recorder. A pen would move back and forth on top of a slowly spinning roll of paper. The display of jAmaSeis uses the same format, but puts it on a computer screen.
Once you have everything working well, you can also use jAmaseis to share your data with students and scientists around the world.
Yes! We've been recording data for a little more than a month now, and we've seen several earthquakes. We see 5.0+ quakes in Oklahoma. We see M6.0+ quakes from around the world. To make sure we're seeing real earthquakes and not just our own noise, we correlate our data with other stations on the USGS (US Geological Survey) site here.
Since setting up our seismometer a few weeks ago, we’ve managed to record several earthquakes from around the world. We’ll share a few samples here, but first, a word of caution for those thinking of getting into the seismology hobby: It can be boring. There are long stretches of time where nothing happens, so you have to have a long-term attitude about catching events.
Don’t expect to see an exciting event every day. Located in Pennsylvania, we’re not exactly at the center of any seismic activity. We’re happy if we get to see one or two events in a month. The past several weeks have been exciting, though -- we've seen half a dozen events!
This event occurred at 12:49 UTC on March 2, 2016, southwest of Sumatra, Indonesia. The P-waves reached us about 20 minutes later, at 13:09 UTC. The dark squiggle represents the quake. The noise afterwards is not from the quake.
The noise/squiggles after the quake came from sunlight streaming in on the concrete floor. For a number of days, we were seeing this noise at around the same time each morning, but only on days that weren't cloudy. We eventually figured out that it was caused by the sun heating up the concrete. By blocking the windows, we were later able to reduce this cause of noise.

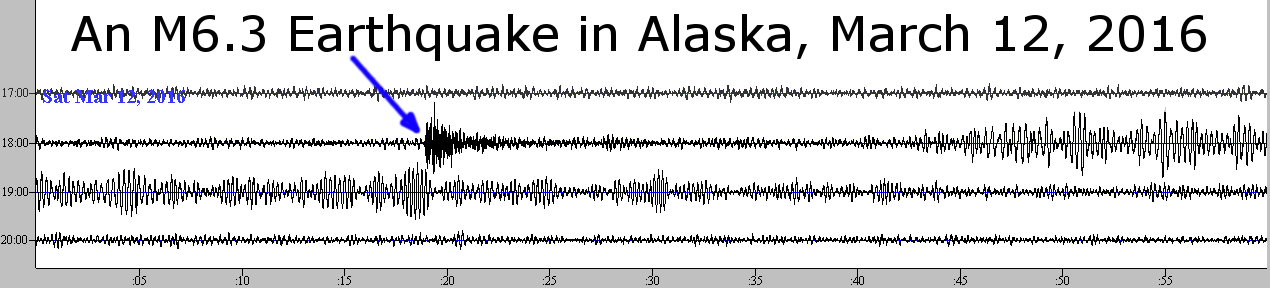
This event occurred at 18:06 UTC on March 12, 2016, south of Atka, Alaska. We saw it at around 18:18, about 12 minutes later. We got a great reading on this one, because we weren't seeing much noise on the seismometer at the time. The quake is really obvious.

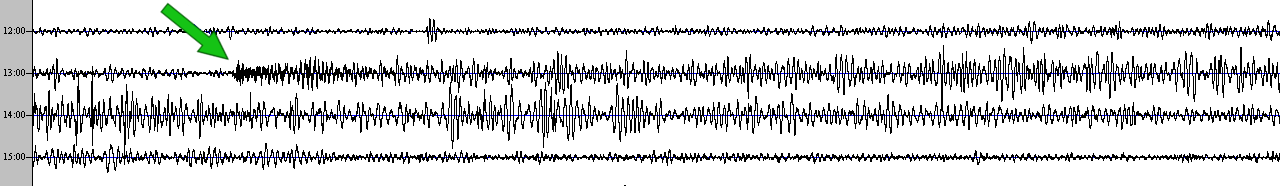
This event is similar, if slightly weaker. It occurred at 1:35 UTC on March 22, 2016, in about the same place in Alaska. Again, it took 11-12 minutes to reach us.
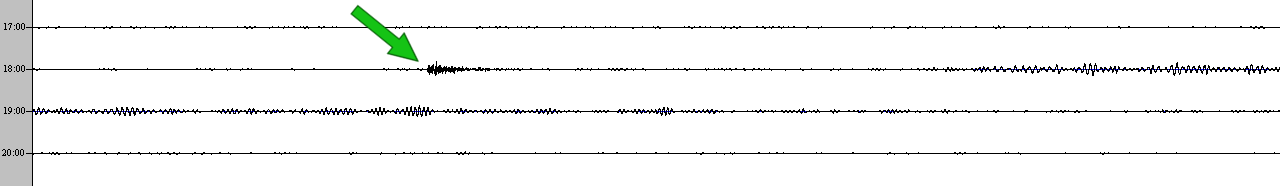
This event occurred at 11:26 UTC on that same day, northeast of Saint John's in the Caribbean. This one is harder to see, because we had a lot of noise in the seismometer data. We think this was caused by a nearby heating unit running in the night and early morning.
You can just barely make out two squiggles in the noise, at about 6 minutes and 10 minutes after the event. This is a good match to when you would expect P-waves and S-waves to arrive.

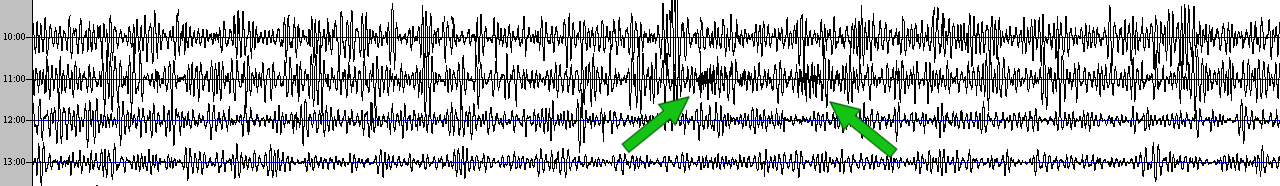
We recorded this at about 00:32 UTC on 3/28. This one looks a little different than the other quakes we recorded. The squiggles aren't as dark, as if the shaking were of a different frequency. At first we thought it looked like noise, but we saw very similar squiggles in other seismometers we looked at. We checked a number of them hosted at schools around the world, right from within that jAmaseis recording software. The timing makes sense when correlated with the eruption time at the Pavlof volcano.
We've also seen a few M5.0+ quakes in Oklahoma. It seems there are a lot of quakes happening in Oklahoma now (link to more info about Oklahoma quakes).
It can be challenging to figure out whether the squiggles on the chart are real seismic activity or noise from another source. Was that an earthquake or someone walking by?
We are still fiddling with our seismometer’s design and location to eliminate noise. We’ve seen noise from the heating system in our building, sunlight heating up the concrete slab it sits on and ground noise during a rainstorm, possibly from water seeping into the ground. Even professional seismometers can see noise from things like storms and heavy surf.
Look at other nearby seismometers to tell the difference. If you’re seeing a real event, you should be able to correlate the data between two different seismometers. If you’re looking at noise from someone dropping a box near your seismometer, you shouldn’t see that same squiggle in another seismometer miles away.

While building this seismometer, we've done a lot of reading and learning about these instruments. We can't include it all here, but if the subject interests you, read about P-waves and S-waves. When you detect these different kinds of motion in the earth, you can use the squiggles on the chart to estimate the distance to the earthquake. By doing this with multiple seismometer locations, you can pinpoint the earthquake's location.
It's a hugely interesting subject. Interpreting these seismometer squiggles is how we know about the interior structure of the earth. It also defines what we can and can't see around the world. Because of how these waves of motion bounce around the earth's structure, there are some places that we can't detect earthquakes from. If you're in the P-wave “shadow zone” of 103° to 142° away from the quake, you can't detect it. No matter how sensitive our instrument, there's just some waves that won't reach our device.
What does this mean for our seismometer located here in eastern Pennsylvania?
We were able to build a complete seismometer for under $100. One of the important ideas behind this simple design is to make it inexpensive and accessible. Many of the folks who ask us about this want to build one for their science classroom.
Here's a list of what we purchased to make ours.
| Component | Value/PN | Digikey P/N | Price Est. | Qty. |
| Capacitor | 0.01µF | 478-4852-ND | $0.24 | 2 |
| Capacitor | 0.1µF | 478-4855-ND | $0.20 | 1 |
| Capacitor | 1µF | 445-5315-ND | $0.28 | 2 |
| Capacitor | 330pF | 478-5212-ND | $0.21 | 1 |
| OpAmp | LT1677CN8 | LT1677CN8#PBF-ND | $4.52 | 1 |
| Resistor | 10k | 10.0KXBK-ND | $0.08 | 2 |
| Resistor | 866k | 866KXBK-ND | $0.08 | 1 |
Good luck and have fun! If you haven't built one yourself, you can always check out what our seismometer is currently showing here.


 Cart
Cart