We are now required to collect sales tax in several states. Learn more about tax exempt status for your business.
One year ago, we described our experience building and testing a seismometer using magnets and a slinky. By sensing tiny movements of the magnet bouncing up and down, we were able to detect earthquakes from around the world! After over a year of collecting data, we thought we'd share some of our successes, failures and unsolved mysteries.
CAUTION: The following material contains disturbing information about spiders. Yep, spiders.
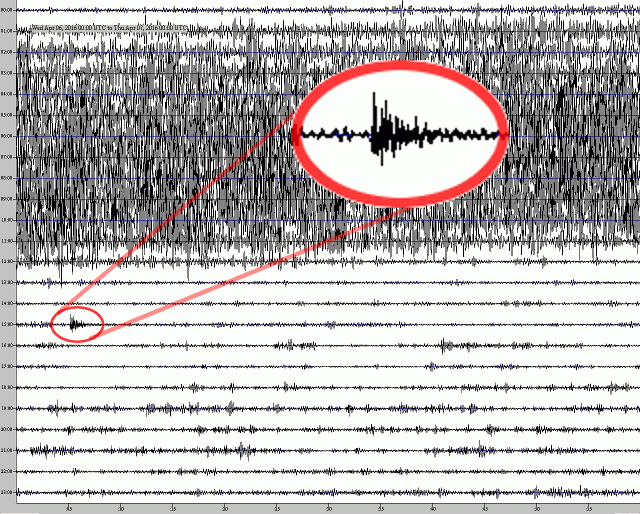
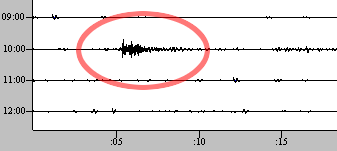
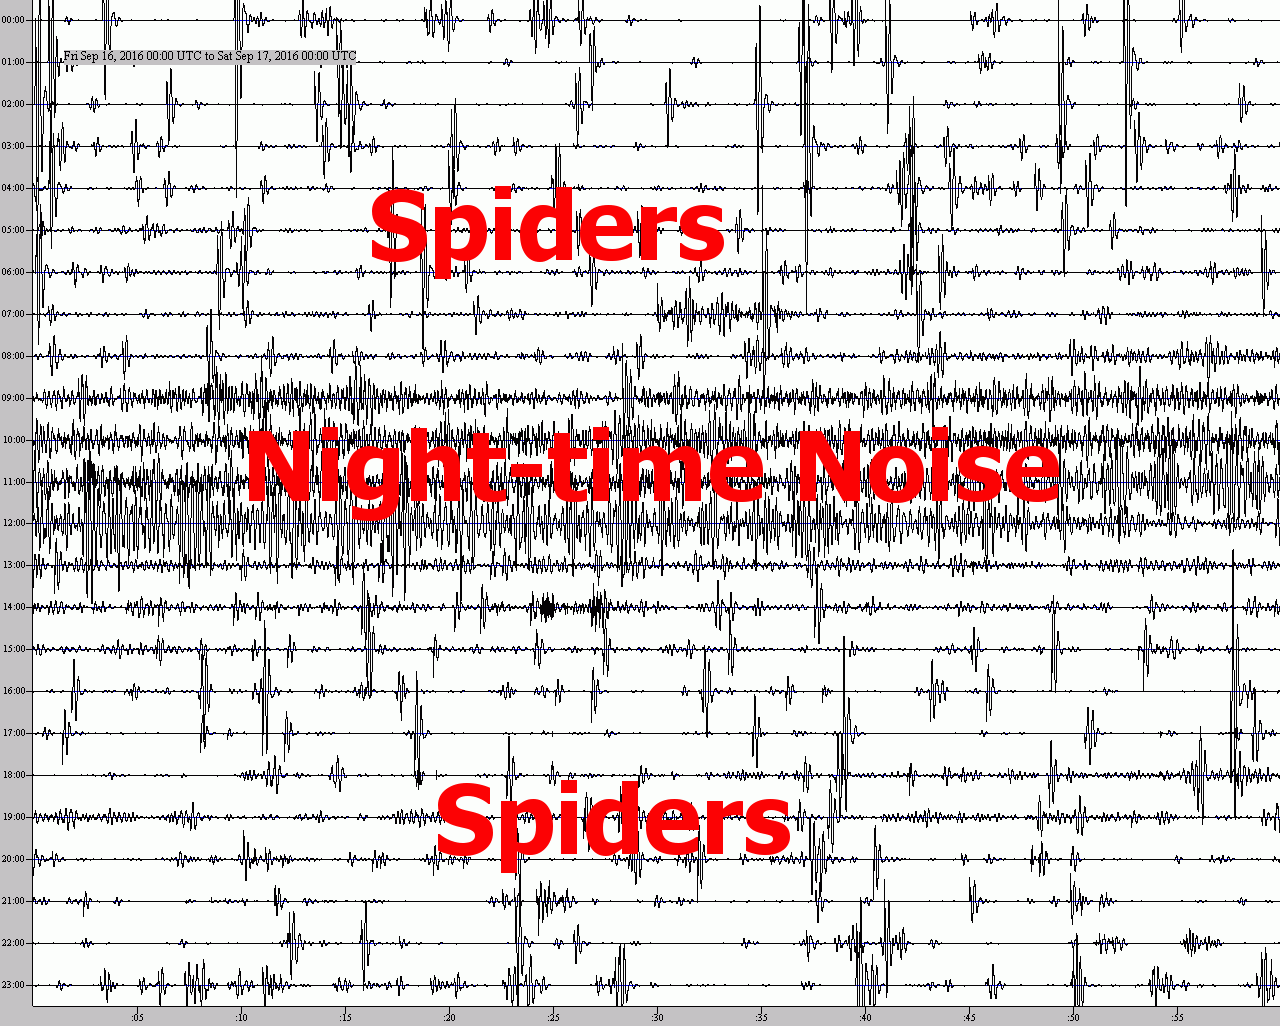
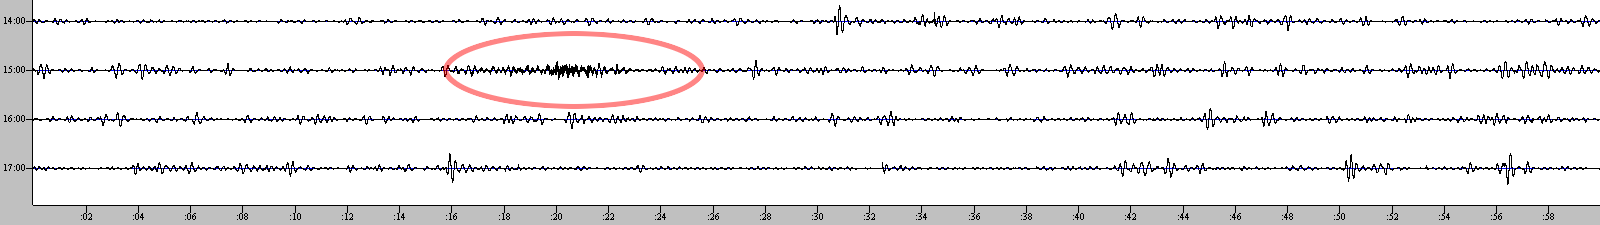
4/6/2016: We see an M6.1 Earthquake in Indonesia. This day's plot seems to capture both the year's successes and problems, all in one day. The signal showed excessive noise throughout the nighttime hours. We saw this noise in many of our plots throughout the year. It took us a while to figure out the root cause (temperature, but more about that later).
Despite the noise, there's evidence of an earthquake at 15:05 UTC on the plot. The timing makes sense for an M6.1 quake in Indonesia that occurred around 14:45. It takes about that long for the waves to reach us from most of the way around the world!
4/13/2016: M6.9 earthquake in Burma/Myanmar, occurred in a place that we though we couldn't detect. This powerful earthquake caused a number of injuries but no fatalities, thankfully (news link).

The timing indicates that this is the quake we're seeing, yet something is strange. In our first article, we described how there's a region on the opposite side of the earth where we shouldn’t be able to detect earthquakes. This one is clearly located in that red area. How are we detecting anything?
This stuff is well outside our area of expertise, so we asked for help on reddit. We got a really great reply, which we'll just share here:
The seismic shadow zone has a few inherent assumptions that don't always hold true that need to be addressed here.
Seismic wave velocities are governed by properties of the materials they pass through, namely the density and elastic moduli. In order to determine the way the rays behave within the earth we need these ray path models need to be given values for the specific variables that affect them, so usually they use a layered earth model. In a layered earth model, the crust has one set of values, the mantle has another set, the outer core and inner core, all have distinct values that are fed into the models to make them work. Now, this is a relatively good approximation for changes with depth, but it implies that each individual layer is laterally homogeneous, which is absolutely untrue. Even the mantle has different layers with different properties due to mineral phase transitions, occasionally there subducting slabs, or hot, upwelling mantle plumes, all of which the waves pass through. When these waves come into contact with materials with different material properties they bend or reflect (following Snell's law) or sometimes diffract. Ray paths of seismic waves aren't as clear cut as they show in the text books.
Another assumption in the seismic shadow zone is that it assumes a source that occurs at the surface. When that happens the wave front moves out in a hemispherical shape. This earthquake in Burma was 140 km deep, which is in the upper mantle. Now you're adding a depth phase (waves that move up from the point source), so those waves will hit the air-earth interface and reflect back down and continue to travel on their paths to reflect, refract, and diffract off all the anisotropies of the earth's interior.
Check out figure 3 in this IRIS report as it's more appropriate to the earthquake that happened in Burma.
Ultimately, I don't think it's weird that you're getting a reading.
Awesome.
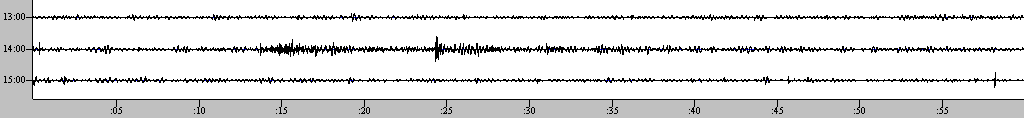
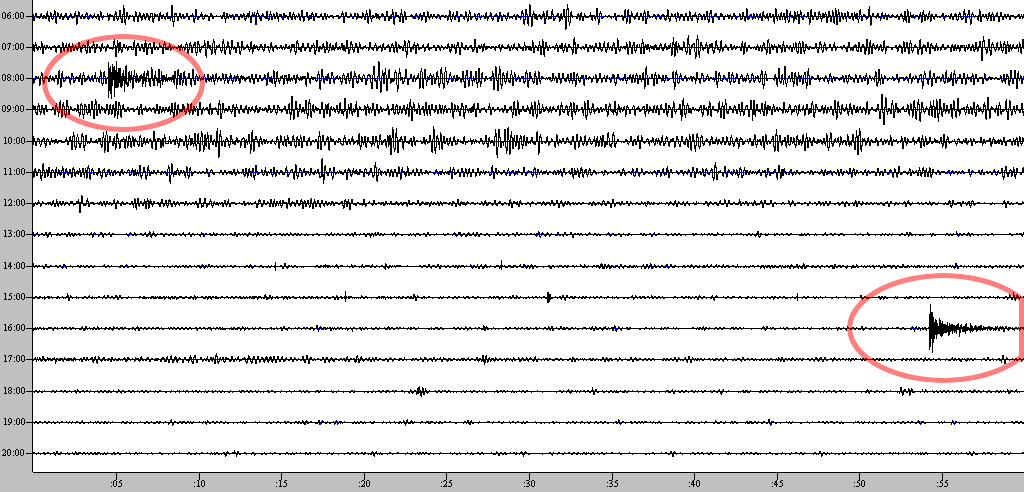
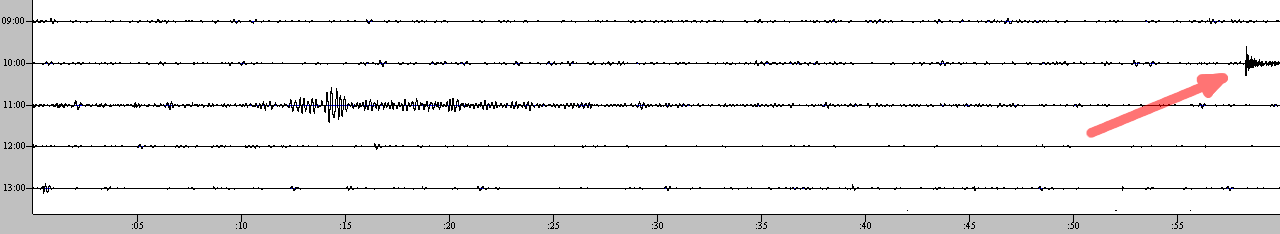
5/18/16 An M6.7 quake in Ecuador occurred at 7:57. We detected it around 8:05. Later in the same day, an M6.9 quake hit the same place.
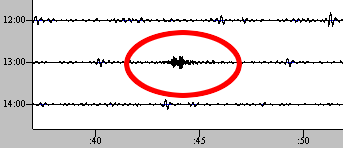
Let’s take a moment to explain what these charts show. They are generated in software, but they look like the old chart recorders, where a roll of paper would slide by under a pen that squiggled back and forth.
The vertical axis, marked along the left side, shows the hours. Each hour, the “pen” slides across a line from left to right. It takes a full hour for the pen to go from the left side to the right. If the seismometer moves, the pen squiggles up and down.
The horizontal axis, marked along the bottom, shows the minutes. Each successive line down the picture is the next hour of data.
5/28/16 A powerful M7.2 quake occurred near the South Sandwich Islands. That's way down in the south Atlantic ocean, a few thousand miles east of the southern tip of South America.
6/7/16 An M6.3 quake out at sea, off the west coast of Mexico.
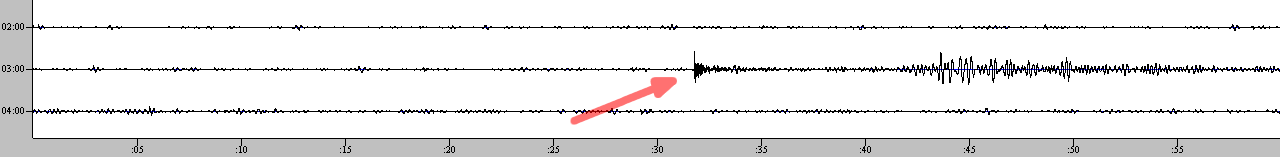
6/10/16 An M6.1 quake in the northwest corner of Nicaragua, just east of Puerto Morazan.
This quake happened relatively close to us, in central America. We saw both the initial P waves arrive around 3:31, followed by the S waves.
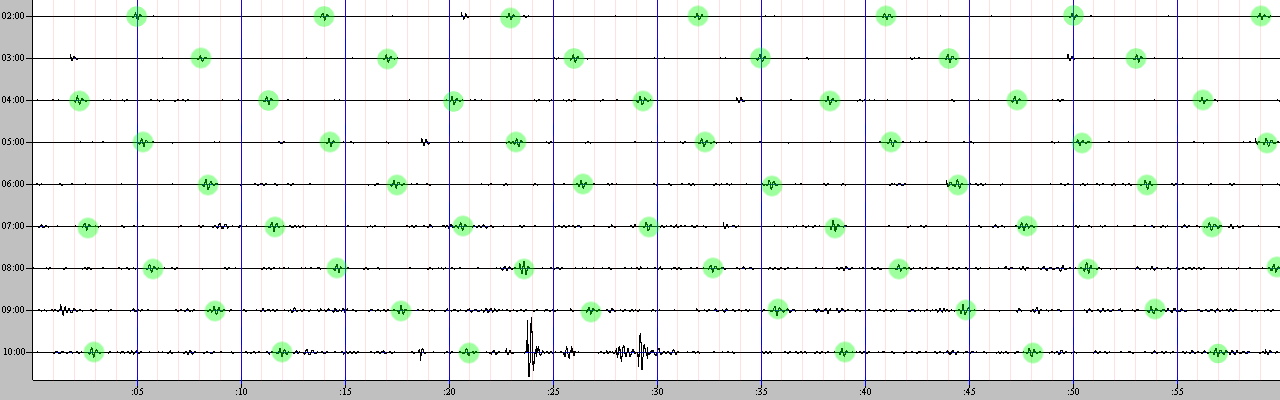
Here's a strange mystery we haven't been able to solve yet: We often see small periodic blips that happen every 9 minutes. What is causing this? Is there something happening in our building every 9 minutes? Or is there something internal to the seismometer that causes this? The cause is still unknown.
We theorized that there might be something in the Arduino’s code, maybe a sampling window or memory thing that happens every nine minutes. Looking through what the code does, we didn’t find anything obvious. The Arduino’s tiny memory can’t even hold 9 minutes worth of data! It just processes it and spits it out to the PC. All the interesting cycles are happening much quicker than 9 minutes.
We looked at the data from other TC-1 slinky seismometers around the world. If the cause is inherent in the design of the device, we should see a similar thing in other folks’ data. The results were mixed. Some showed no sign of it, while a few did. That doesn't help us understand the cause, but at least we know it's not just us.
This plot from a competent seismometer in Idaho has a similar 9-minute cycle.
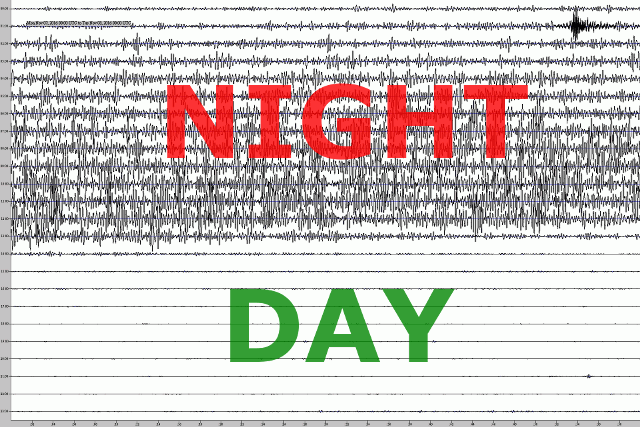
For much of 2016 we had issues with noisy data. The output showed squiggles in the line that were clearly not earthquakes. It was worse in the nighttime hours, disappearing during the day.
It wasn't a big problem last summer, but the noise started in earnest in Sept-Oct as it became colder. By Nov-Dec, it was noisy every night.
After fruitlessly trying a few different fixes, we guessed that temperature might be affecting the decice. We moved our seismometer from a forgotten warehouse corner into our office. We'd occasionally get false squiggles from people walking nearby, but at least we could see if cold temperatures were the cause.
With the seismometer in the office for just a few nights, it became clear that the noise was due to temperature. The office is more carefully temperature controlled than that warehouse, so we were able to prove that low temperatures have been causing the noise. If the device gets below about 59°F (15°C), the noise begins.
Keep your seismometers warm!
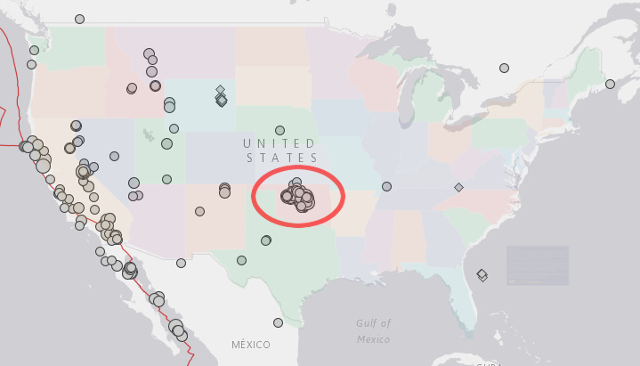
7/17/2016 An M4.2 quake in Oklahoma, USA. We see many M4-M5 quakes from Oklahoma. Though hard to link direct correlation, many seismologists think this increased activity is associated with water injection and fracking.

While the debate is still ongoing (more info here and here), it seems that the increase isn't caused by fracking itself, but by injection of wastewater. While that might be true, the argument seems disingenuous to us. The fracking process creates a lot of wastewater that needs to be disposed of. The unwanted, usually salty water is a byproduct that comes out of the fracking process, along with the useful gas.
That seems like saying car washing isn't causing so much soapy water to run into the street, but the people rinsing them off outside. Well, duh! Fracking might not be so profitable if they didn’t have an easy way of getting rid of all that salty water without making the farmers angry.
The debate is often more political than purely scientific or data-based. Science is still working on what we can learn and understand. We don’t have all the answers we'd like. It’s not currently possible to point to a specific quake and see the chain of events to determine the root cause without a doubt. It’s hard to say if a particular quake was caused by human activities, though the correlation between increased quakes and human activity is pretty clear.
We all want cheap energy. How do we account for the actual costs, though? Is it worth getting cheaper energy to heat my home if I have to pay to shore up the foundation for repeated minor quakes? You would need good data to answer that question, and the jury is still out.
From USGS data, we found that 136 of 331 earthquakes in the continental US in 2016 that were M3.5 or greater occurred in this region of Oklahoma and southern Kansas. That’s about 40% of US quakes. It's also a very recent change that has ramped up over the last few years. Ten years ago, this wasn't a thing.
7/18/2016 How about a less controversial man-made event that we detected? The event classified as an M3.7 in Virginia wasn't an earthquake at all. It was a Mine Collapse!
We captured this, "unusually large roof collapse in a longwall mining operation in Buchanan County, VA." Local news link.

7/29/16 A powerful M7.7 earthquake in the Northern Mariana Islands, in the Pacific Ocean.
This is a really big quake, which we see ringing on for quite some time on our sensor! It might not be a scientifically accurate description, but plots like this seem like the earth is ringing like a bell. At least, our slinky is! The event occurred at 21:18, but didn't begin to reach us until nearly twenty minutes later.
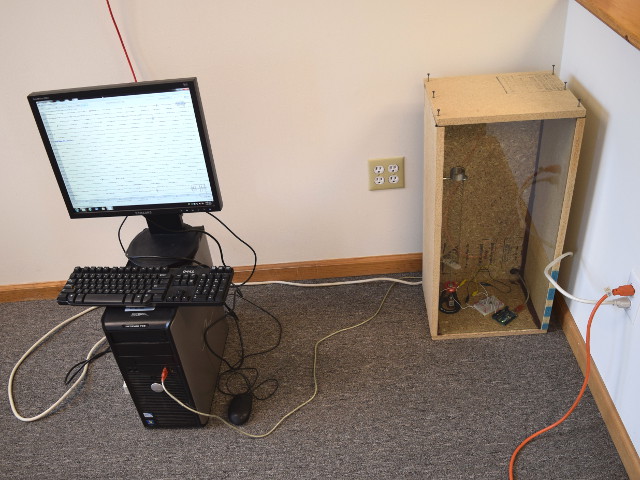
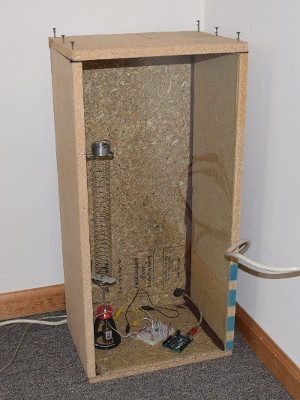
We didn't originally make a fancy case for our seismometer. We saw some seismometers in schools housed inside wonderful glass or Plexiglas enclosures. Ours was kept in a forgotten corner of a warehouse.
We quickly learned that you can't leave a slinky seismometer in the open air. Even very tiny, indoor air currents will move the slinky enough to make the output very noisy. To block air currents, we covered the whole thing with a cardboard box. An ugly solution, but it worked well enough.
We later discovered that tiny little spiders had made a home inside our seismometer. They built wispy webs that reached from the inside of the box to the slinky itself. Our data would be quiet for a long time, but then one spider would walk along a web that was attached to the slinky. Our very sensitive device interpreted this spider’s dance as earth-shattering movement!
After cleaning out the box several times, we admitted defeat. We were losing the battle against the spiders. We made a wood box with a glass front to make the case more spider-proof. It’s still not the prettiest, but it keeps the spiders out.
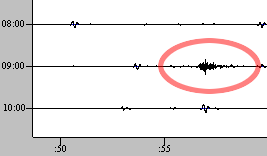
8/17/16 An M4.0 in Oklahoma, USA. We seem to be pretty good at detecting these M4 to M5 quakes in Oklahoma.
8/23/16 M6.0 - 132km N of Nebe, Indonesia.
8/27/16 An M4.8 quake 35km E of Hoback, Wyoming, more info at temblor.net.

8/29/16 An M7.1 in the South Atlantic Ocean. This quake occurred as the result of strike-slip faulting near the Mid-Atlantic Ridge plate boundary separating the African and South American plates. At the location of this earthquake, the African and South America plates diverge at a rate of a bit more than 1 inch per year, in an east-west direction.
Earthquakes are common here. Over the past century, at least half a dozen M6+ earthquakes have occurred here. None of these events are known to have caused tsunami or damage.

11/7/16 M5.0 west of Cushing, Oklahoma. There's a lot of nighttime noise we saw with our sensor in the cold warehouse, but the quake is pretty unmistakable.
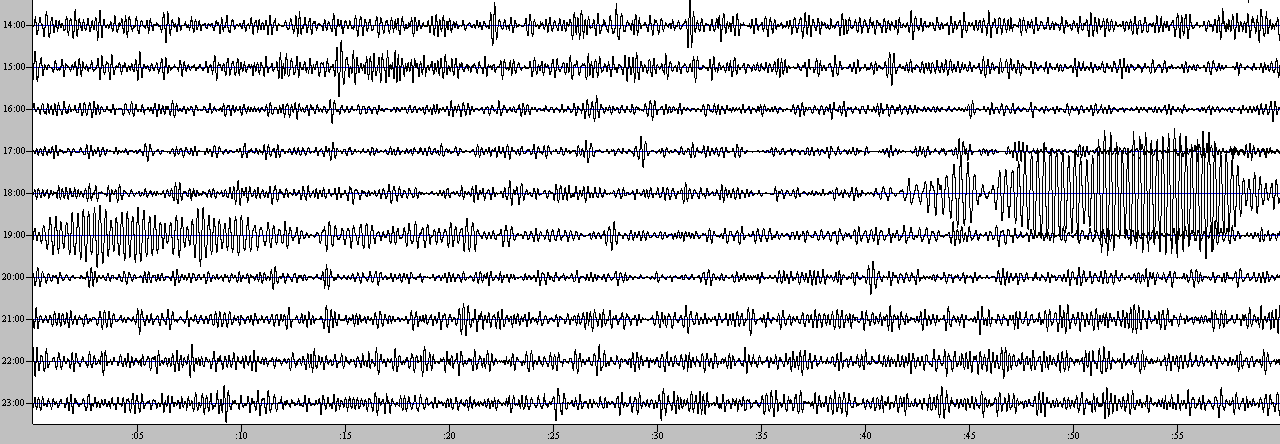
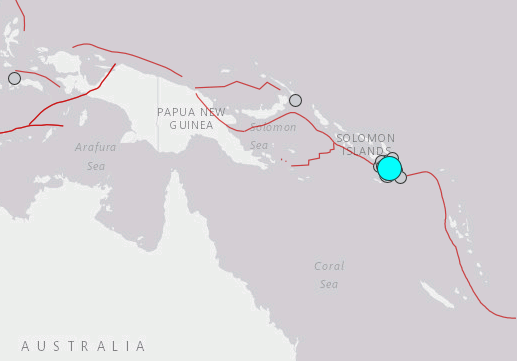
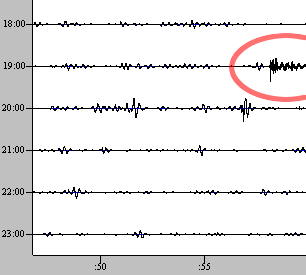
12/8/16: This day is a noisy mess for us, but includes a hint of something interesting. There's some huge amplitude waves from about 18:40 to 19:20 UTC, which we see duplicated on other seismometers. This is probably from the huge M7.8 quake in the Solomon Islands, followed by a bunch of aftershocks in the M5-M6 range.
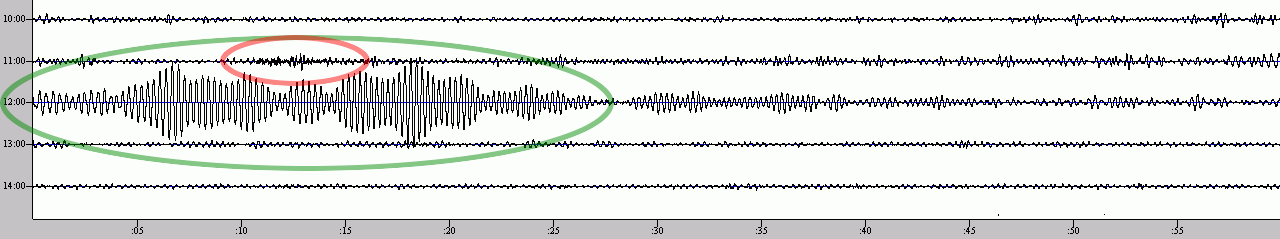
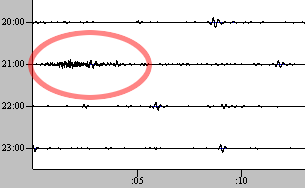
12/17 A huge M7.9 off Papua New Guinea. This one looks like a similar shape on our seismometer, though we have a lot less noise this day.
There's a M7.9 that happened in Papua New Guinea at 10:51 UTC. It's followed up by an M6.3 at 11:27, one doozie of an aftershock.
We see a small, but dense looking squiggle around 11:11, about the right time for P waves. We see the longer phase "ringing" for about 20-25 minutes starting around 12:00UTC. Are those surface waves?
12/25/16 A powerful M7.6 near Puerto Quellon, Chile. We captured the P waves (direct) from this powerful quake.
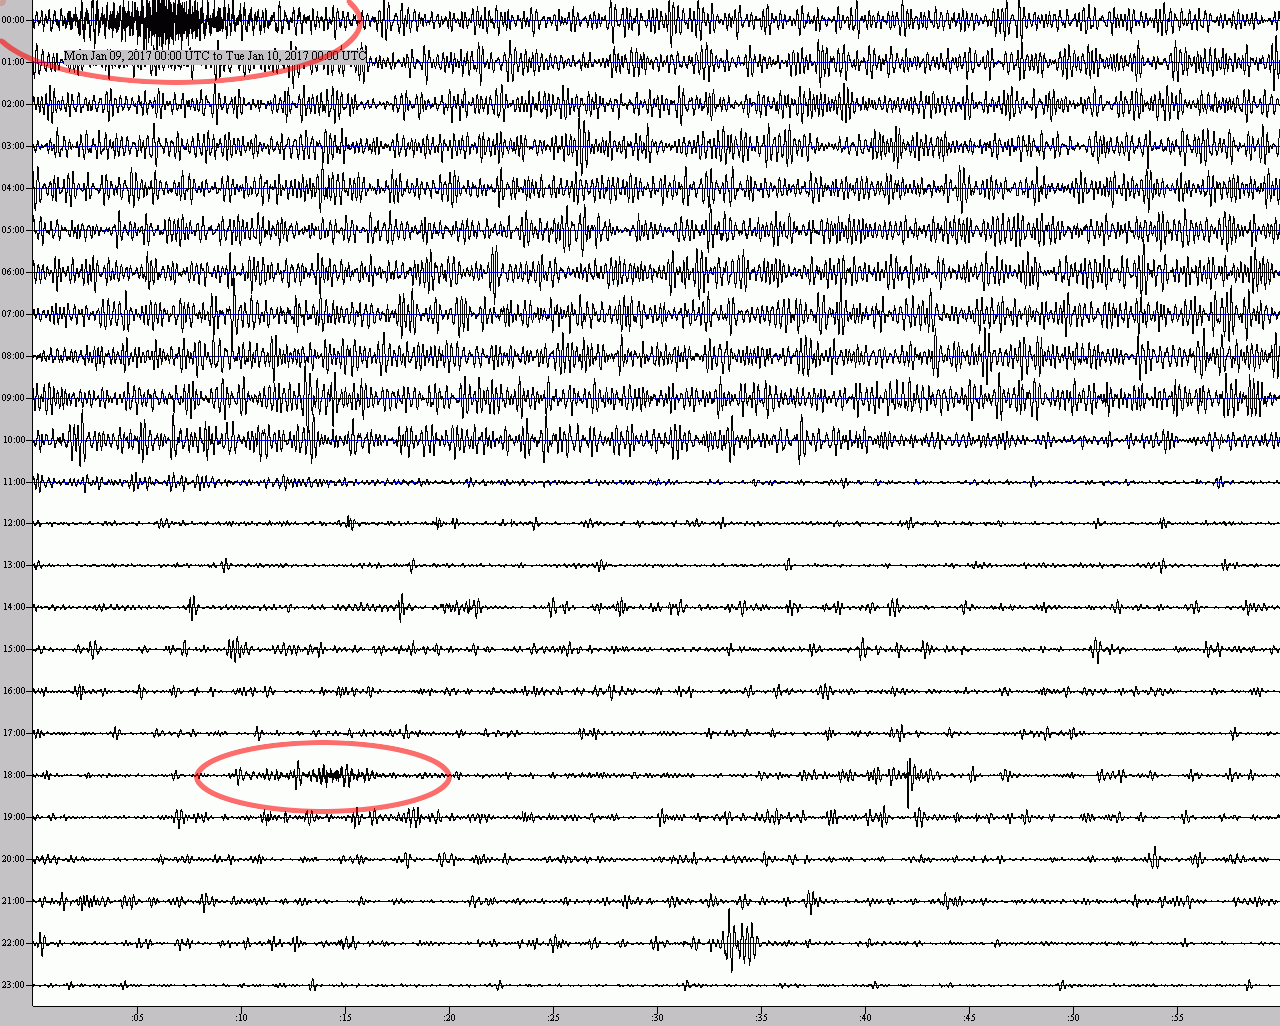

1/8/2017 A strong M6.0 east of Resolute, Canada. This event occurred at 23:47 UTC on the 8th, but the evidence in our signal doesn't show up in Pennsylvania until 15 minutes later, on the 9th. It's a good signal which matches up well with other seismometers.
1/9/2017 A follow-up M5.2 in the same place. Later that same day, we recorded what was probably an aftershock in the same location as the first earthquake. This place is pretty close to the north pole. News link.
Resolute has a population of around 240. It is the second-most northerly community in Canada.
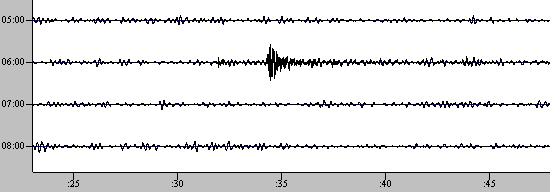
1/10/2017 M7.3 in the Philippines, recorded here in PA. Philippine seismologists said the earthquake was far too deep to cause any damage and casualties or generate a tsunami.
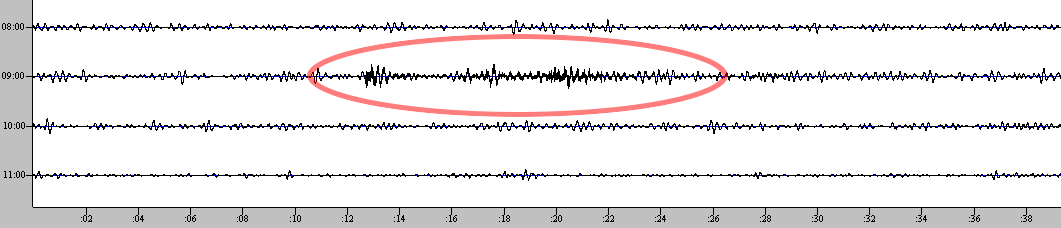
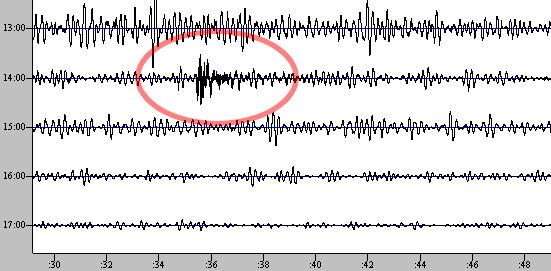
1/17/2017 This M5.8 south of Guisa, Cuba was recorded quite well on our seismometer. The initial P waves arrived just after 9:12 UTC, followed by the S waves after 9:16. The data matches other seismometers here in Pennsylvania.
Before and after that quake, a number of smaller M3 quakes occurred to the east near Puerto Rico, but our instrument was unable to see any of these.
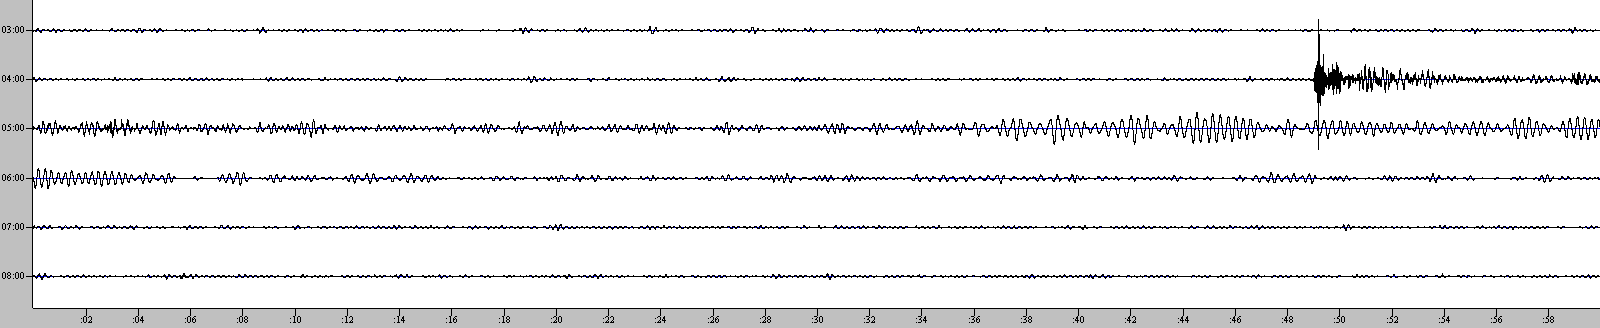
1/22/2017 The powerful M7.9 occurred deep beneath Bougainville Island in the North Solomons, east of Papua New Guinea. The quake was strongly felt around the region and triggered tsunami warnings for coastal parts. Fortunately, the tsunami didn't happen.
…landslides occurred in the Panguna area, including at Nagovis. "Two men were covered with soil, but they were fortunate to dig themselves out from the ground, and they were taken to hospital. But there was no deaths." While provincial authorities are still gauging the extent of damages from the quake, social media dispatches from Bougainville indicate that numerous homes sustained damages and that various sealed roads have been cracked.
Bougainville is in a region renowned for frequent earthquakes. It sits on plate boundaries that form part of the seismically active Pacific Rim of Fire. Our plot records a big shake initially, and further movement for at least two hours afterwards.
2/10/2017 This M5.2 east Resolute, Canada was in the same location as the earlier quakes in January.
This list turned out to be a lot longer than we had initially anticipated. If you’re still with us this far down, wow, thanks for sticking around. We’re out of cool earthquake trivia to share, but you might find this incredibly interesting:
We can’t predict when earthquakes will happen. There is, however, a system under development that will send people messages when one happens, giving some small amount of warning time. The system works by detecting when an earthquake happens, determining its strength and location using data from many seismometers. It then sends messages (think: smartphone) to warn people that it’s coming.
Check out their website, www.shakealert.org or this informational YouTube video.
It may not seem like much, getting a message that an earthquake is coming in ten seconds or thirty seconds, but this is huge. It’s accurate – it’s really coming, not a prediction that may or may not happen. It’s also really helpful to get a little prepared. Your train engineer can put on the brakes. Your surgeon can pause for a moment, and wait for it to pass. You can step away from windows.
Hopefully, we’ll see this system get fully implemented.


 Cart
Cart

